Few Investing strategies have produced as many consistent winners as William O’Neil’s CANSLIM system — this powerful, data-driven approach has created millionaires, produced championship-level returns, and helped investors navigate both bull and bear markets for decades.
In this comprehensive guide, you’ll discover:
- The seven key components that power the CANSLIM system
- How to identify stocks with explosive growth potential before they make major moves
- Precise entry and exit strategies that maximize profits while minimizing risk
- Real-world case studies of CANSLIM principles in action Advanced techniques used by champion investors
Whether you’re new to investing or looking to refine your current approach, mastering CANSLIM could be the difference between average returns and extraordinary performance. Let’s dive in.
CANSLIM’s Proven Track Record: Top Investors Achieve Extraordinary Returns
CANSLIM isn’t just another investing theory—it’s a battle-tested methodology backed by over 100 years of market data and verified by the extraordinary success of its followers:
- David Ryan: Generated a stunning 1,379% return in just 3 years and won the U.S. Investing Championship three times
- Mark Minervini: Achieved a 344% return in a single year to become the 2021 USIC champion
- Oliver Kell: Delivered 941% gains to win the 2020 USIC
- Matt Caruso: Came runner up with 346% returns in the 2020 USIC
Unlike approaches that rely solely on technical analysis or fundamental research, CANSLIM integrates the best elements of both worlds, adds crucial market psychology insights, and provides a complete framework for selecting high-potential stocks at the optimal time.
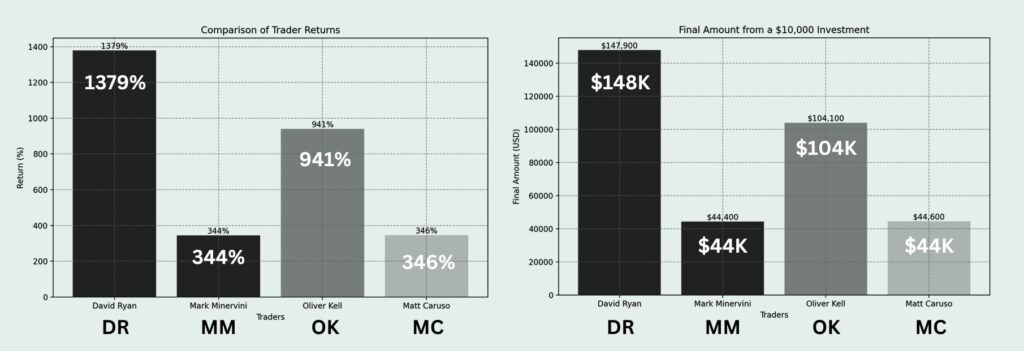
Starting with $10,000 you can see just how far these trading growth metrics can take you! Compound again the next year and this could become exponential. Caveat, these returns are realised in exceptional market conditions, Bull runs to be specific.
And there are many more who use Canslim as the foundation of their trading strategies! (Twitter is a great place to find them).
“Success in a free country is simple. Get a job, get an education, and learn to save and invest wisely. Anyone can do it. You can do it.”
― William J. O’Neil
Why CANSLIM Outperforms: The Power Behind the Strategy
The CANSLIM investment strategy stands as one of the most powerful systems because it selects for the most high-potential stocks in the market. It also has to do with precise risk management and position sizing — you are meant to concentrate your positions instead of spread them thin.
If you want to over-diversify with 20 plus different stocks, you will match market returns, you may as well buy an ETF at that point. If you want to outperform the market, you will have to learn how to concentrate your positions safely with Canslim.
William O’Neil’s History & Developing Canslim
William J. O’Neil, founder of Investor’s Business Daily developed this methodology and in his time, he consistently produced market-beating returns for decades.
It came about after he started studying the best stocks that outperformed the market by miles. He came up with seven factors that determined a stocks strength and potential. He called this CANSLIM. It integrates fundamental analysis, technical analysis, and market psychology into one cohesive framework. Each letter represents a critical factor O’Neil identified.

After studying hundreds of the most successful stocks from the 1880s through the 1980s, O’Neil identified specific patterns that appeared repeatedly in stocks before they made their biggest gains. This research became the foundation for CANSLIM.
“• SECRET TIP—The first step in learning how to pick big stock market winners is to examine leaders of the past, like those you’re about to see, to learn all the characteristics of the most successful stocks. From these observations, you will be able to recognize the types of price and earnings patterns these stocks developed just before their spectacular price advances.”
― William J. O’Neil
O’Neil’s approach was revolutionary because it was based on empirical research rather than theories or opinions. He didn’t create CANSLIM based on what he thought should work; he discovered what actually worked.
The 7 Key Components of CANSLIM: A Complete Overview
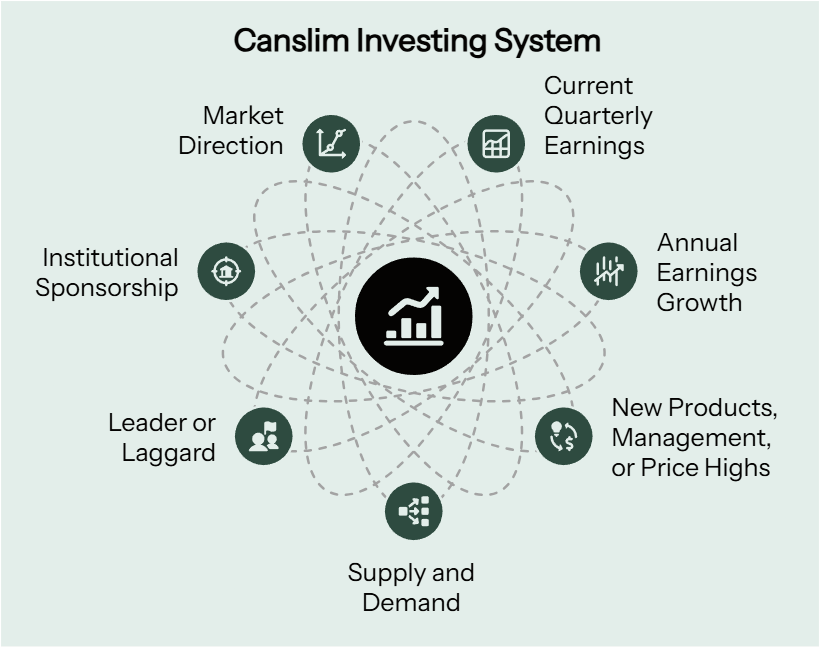
C: Current Quarterly Earnings
A: Annual Earnings Growth
N: New Products, Management, or Services
S: Supply and Demand
L: Leader or Laggard
I: Institutional Sponsorship
M: Market Direction
Canslim is different, it’s not pure price action trading, it’s also not pure fundamentals. It’s a blend with some added common sense. The approach is comprehensive, combining fundamental, technical, volume and price action analysis. Plus a heavy weighting on the market environment, appropriate position sizing and risk management too.
CANSLIM integrates the best elements of stock market analysis, creating a holistic system that addresses every aspect of successful stock selection and timing.
Even if you’re not dead set on trading this system, learning from it will still benefit you tremendously, I guarantee it.
Historical Canslim Performance and Success Rates
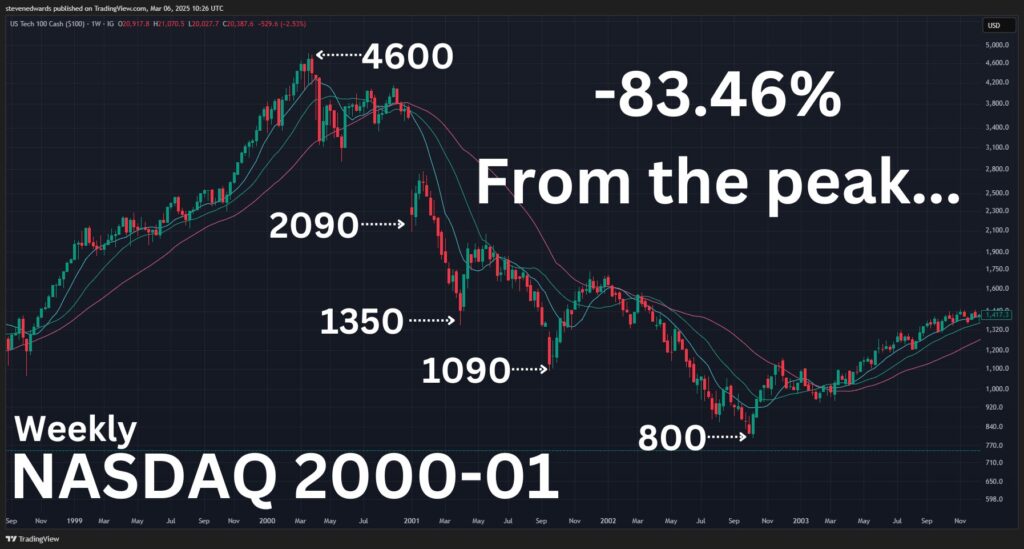
During the 1998-1999 bull market, if you had followed the Canslim principles then you would have identified virtually all of the market’s biggest winners before their major moves, including names like Qualcomm, Yahoo!, and Amazon – stocks that delivered returns of 500%, 800%, or even 1,000%+ in relatively short periods.
The historical performance of Canslim stocks speaks for itself. I did some digging and found two studies that have shown that stocks meeting Canslim criteria have consistently outperformed the broader market.
The results are modest in these studies and don’t outperform like the Canslim Investing champions but over time the extra growth rate compounded would still massively outperform and overtake the markets.
Why CANSLIM Remains Relevant in Today’s Market
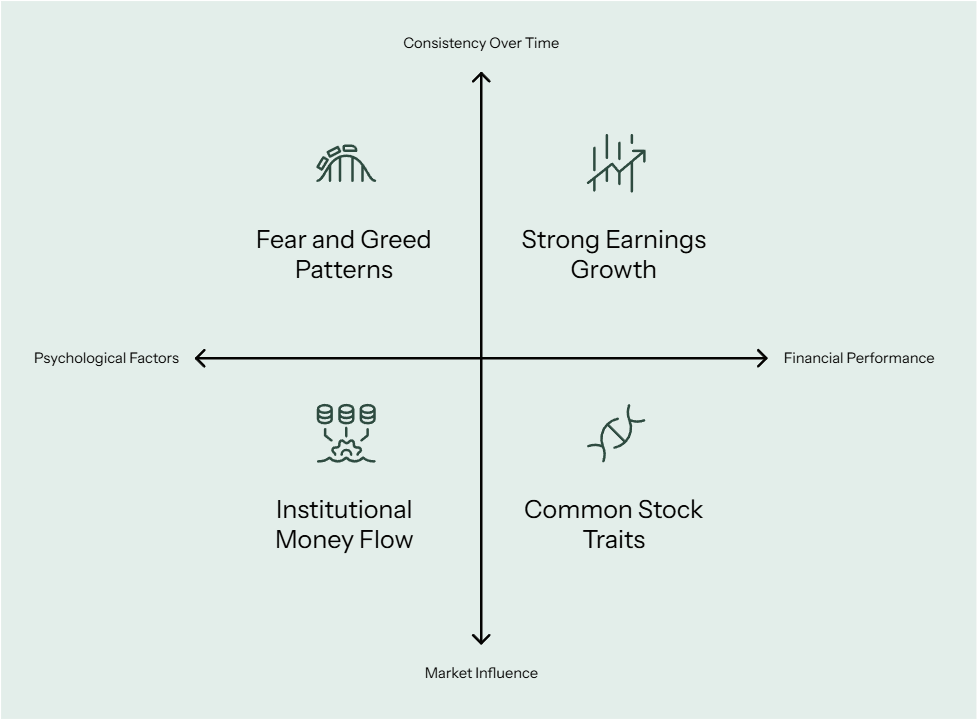
Despite being developed decades ago, Canslim’s principles remain extremely relevant even today. Why? Because Canslim is based on how markets actually work rather than theoretical models.
The strategy recognizes:
- Earnings still drive stock prices – Companies producing strong, accelerating earnings growth continue to outperform over time
- Human psychology doesn’t change – The patterns of fear and greed that create bases and breakouts remain constant
- Institutional money still moves markets – Following what the “smart money” (Institutions) is doing remains crucial
- The best stocks still share these common traits – The DNA of winning stocks is remarkably consistent across decades
Sure there are algorithms now and new technologies are coming out all the time, but the core principles that determine which stocks will become big winners haven’t changed. This timelessness makes CANSLIM as powerful today as it was when O’Neil first developed it.
CANSLIM at a Glance: The 7 Key Components
Before diving deeper into each component, let’s take a quick look at the essential elements of the CANSLIM system:
| CANSLIM Element | Primary Criteria | Why It Matters |
| Current Quarterly Earnings | Minimum 25% increase | Indicates strong current momentum |
| Annual Earnings Growth | 25%+ growth over 3+ years | Shows consistent performance |
| New Products/Management/Highs | New catalysts or price strength | Provides growth drivers |
| Supply and Demand | Strong volume patterns | Shows institutional interest |
| Leader or Laggard | Leading stock in leading industry | Identifies true market leaders |
| Institutional Sponsorship | Growing professional ownership | Confirms “smart money” interest |
| Market Direction | Aligned with overall market trend | Ensures favourable conditions |
Now that you have a broad understanding of what CANSLIM is and why it matters, let’s break down each component in detail to see exactly how this system works in practice.
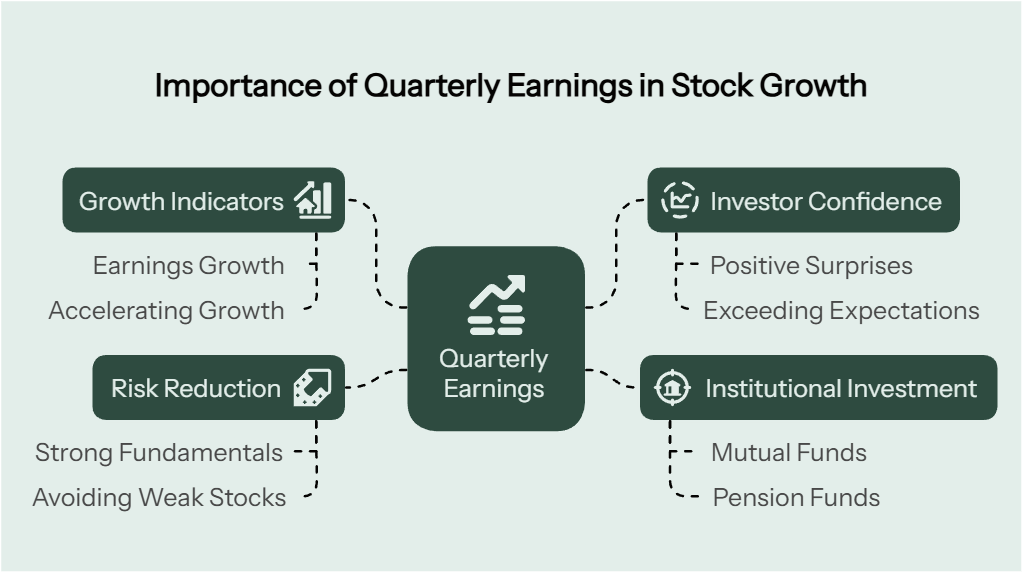
C – Current Quarterly Earnings
The “C” in CANSLIM represents current quarterly earnings per share (EPS) and exceptional earnings growth should be the first foundation of your stock selection criteria.
The higher, the better! For the best growth potential, start with 25% at minimum. The higher the EPS, the more demand there is from retail and institutional traders. It indicates the company is being run efficiently — think of stocks with high earnings growth as a money printing press. Everyone wants to purchase a printing press!
“Charts plus earnings will help you tell the best stocks and general markets from the weaker, riskier stocks and markets that you must avoid altogether.”
― William J. O’Neil
The 25% Rule: Minimum Earnings Growth for Market Winners
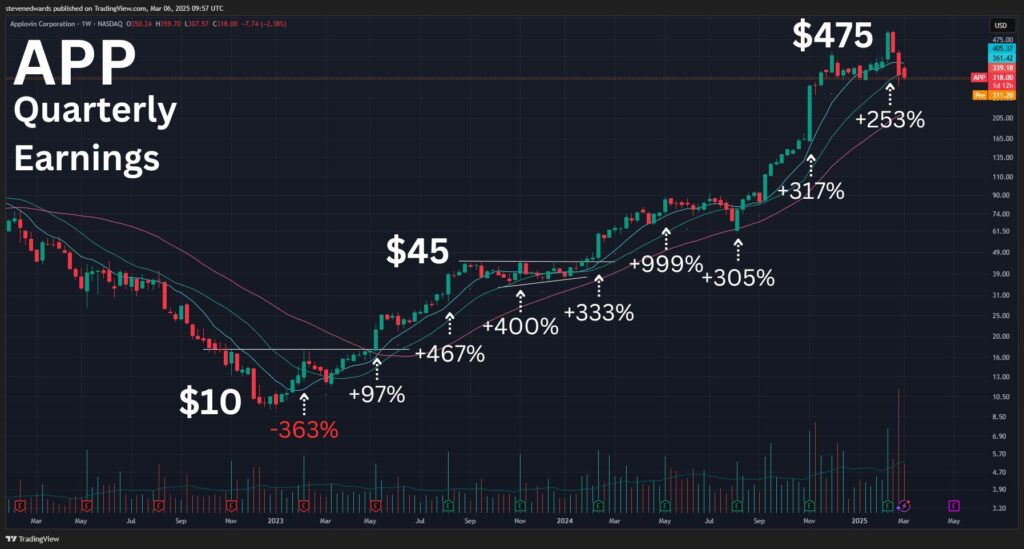
According to O’Neil’s extensive research, the most successful stocks typically show current quarterly earnings increases of at least 25% compared to the same quarter the previous year. True market leaders often have earnings growing at 50%, 100%, or even more — that’s when you find the biggest moves.
Take AppLovin (APP) for example, the earnings went crazy and so did the stock price. Love providing these stock charts to prove the success of Canslim!
The moment high EPS reports come out, institutions start evaluating the potential stock’s growth. If they see potential, and it’s a stock they want, they will accumulate large positions as quietly as possible.
Why is 25% the magic number? O’Neil found that this threshold effectively separates truly exceptional companies from average performers. Companies growing earnings at 25%+ are outpacing not only their competitors but the broader economy as well.
How to Analyse Earnings Quality and Consistency
Not all earnings growth is created equal. This is the due diligence phase, if a stock reports high earnings for the first time, don’t jump straight in. There could be some creative accounting going on. When evaluating a company’s quarterly results, look beyond the headline numbers to assess the quality of earnings:
- Sales Growth: Strong earnings should be supported by strong sales growth (ideally 25%+ as well)
- Non-Recurring Items: Be wary of earnings boosted by one-time events like asset sales, tax benefits, or accounting changes
- Consecutive Quarters: The best candidates show strong earnings for multiple consecutive quarters
Earnings Acceleration: The Rocket Fuel for Stock Price Growth
Perhaps even more important than the absolute level of earnings growth is the acceleration of that growth. When a company’s earnings growth rate increases from one quarter to the next (e.g., from 30% to 45% to 60%), it often signals a company hitting its stride and will likely have explosive price movements.
For example, before its massive run in the second half of 2021, Nvidia showed exactly this pattern of acceleration:
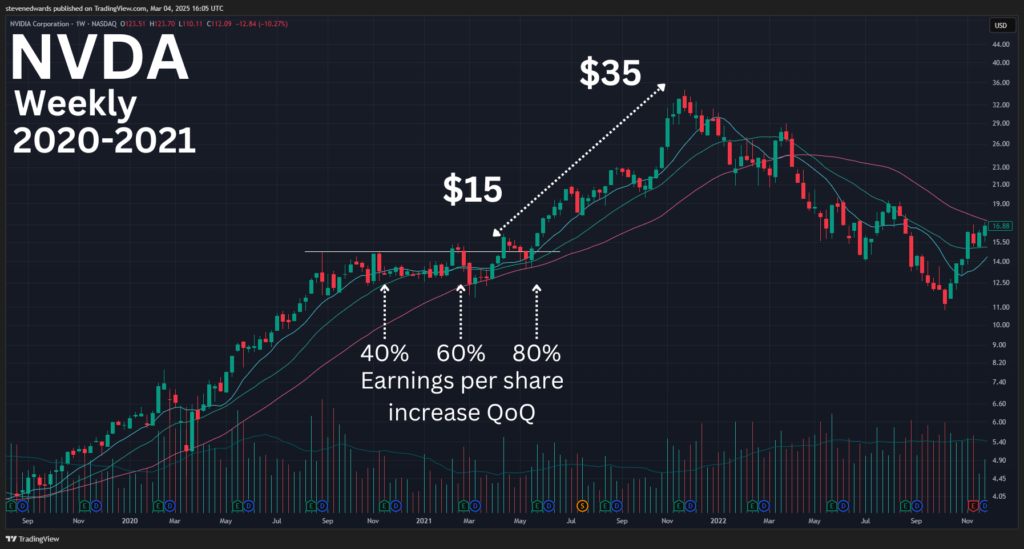
- Q4 2020: 40% earnings growth
- Q1 2021: 60% earnings growth
- Q2 2021: 80% earnings growth
This acceleration was a key signal that Nvidia was poised for a significant move, and indeed the stock more than doubled over the following months. $15 to $35
Essential Tools for Tracking Earnings Data
The best place to get this data is from a company like IBD, Investors Business Daily. MarketSurge is the most expensive product of theirs, roughly $140 monthly but they have cheaper services like Leaderboard ($69) and IBD digital which comes with an excellent budget screener for $40 per month.
One service I haven’t tried yet is Deepvue — I have heard a lot of praise about it and I will eventually try it out. They are focusing on screening and I’m sure they will have fundamental data as the company is quite Canslim focused.
PRO TIP: Always compare a company’s earnings to the same quarter in the previous year, not to the preceding quarter. This accounts for seasonal variations in the business and gives a more accurate picture of true growth.
A – Annual Earnings Growth
While quarterly earnings show current momentum, annual earnings growth demonstrates a company’s long-term performance trajectory. The “A” in CANSLIM requires companies to show consistent annual earnings growth over multiple years.
Building the Foundation: Long-term Earnings Growth Patterns
O’Neil’s research found that the most successful stocks typically show annual earnings growth of at least 25% for each of the last three years before their biggest price moves. This consistent growth demonstrates that a company has sustainable competitive advantages and isn’t just experiencing a temporary boost.
Hope this illustrates the importance of Fundamental factors in stock analysis.
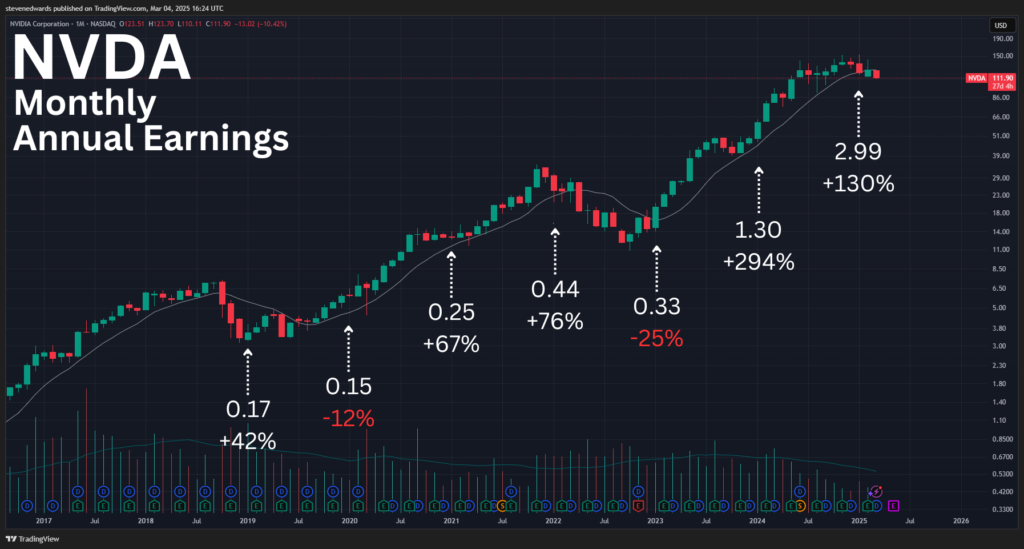
NVDA here shows the power of annual growth rates. From 0.15 EPS $ to 0.25, to 0.44, the increases drove the stock from a split adjusted cost of $6 to $30… Then from $20 to $130 when it’s earnings per share increased from 0.33 to 2.99.
The Importance of Consistent 3-Year Growth
Why three years? Because this timeframe:
- Filters out one-year wonders and flash-in-the-pan performers
- Spans different business and economic conditions
- Provides enough history to establish a clear trend
- Shows management’s ability to execute over time
The most compelling growth stocks show not just growth, but accelerating growth over this period, indicating a company that’s gaining momentum rather than slowing down.
Return on Equity (ROE): A Critical Quality Indicator
Beyond the raw growth numbers, return on equity (ROE) serves as a crucial quality metric. O’Neil found that the best stocks typically had an ROE of at least 17%, with many leaders showing ROEs of 25-50% or higher.
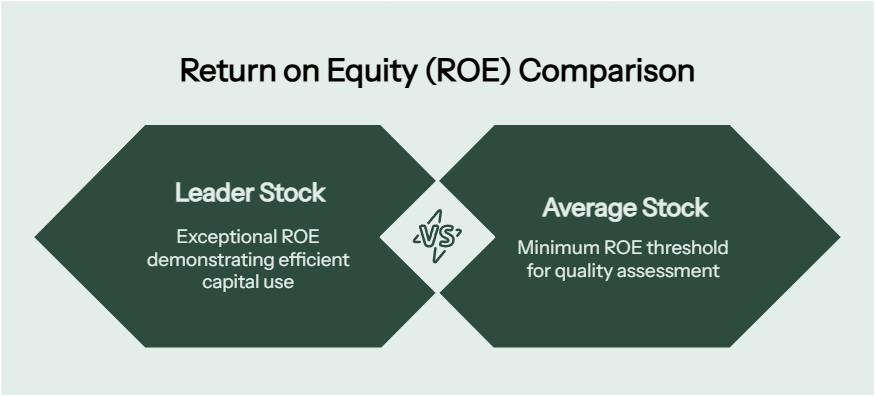
ROE measures how efficiently a company uses shareholders’ equity to generate profits. A high ROE indicates that management is adept at deploying capital to generate returns – a key characteristic of truly exceptional businesses.
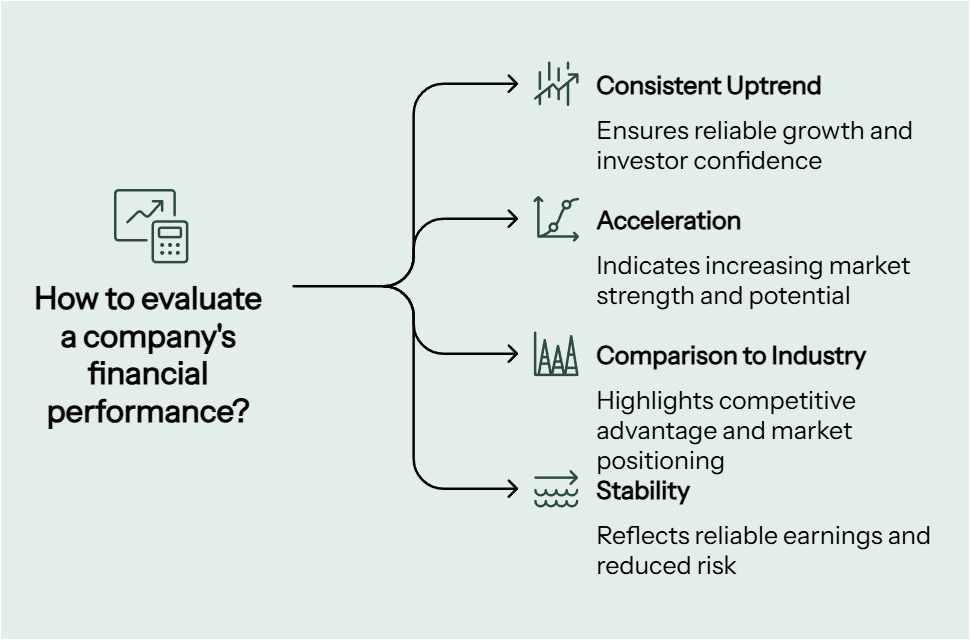
How to Analyse Multi-Year Earnings Trends
When examining a company’s annual earnings history, look for these positive patterns:
- Consistent uptrend: Each year should show growth, without significant down years
- Acceleration: The percentage growth rate ideally increases year-over-year
- Comparison to industry: Growth should outpace industry averages
- Stability: Earnings should be relatively consistent, without wild fluctuations
Case Studies: Stocks with Stellar Annual Growth Records
Consider TSLA that demonstrated exceptional long-term growth before it’s consistent stock price appreciation:
Tesla (TSLA) before its 2020 breakout:
2018: EPS -$0.09 (loss)
2019: EPS $0.01 (+111% just profitable)
2020: EPS $0.75 (+999% turned truly profitable)
2021: EPS $2.26 (+201% exponential growth)
2022: EPS $4.07 (+80% growth continues)
Tesla’s progression from losses to massive profitability signalled a fundamental transformation that preceded its stock price explosion.
From September 2019 TSLA was trading at $16 and in 2021 it was at $270, climbing further to $400 at the end of 2021.
N – New Products, Services or Management
Innovation drives growth. The “N” in Canslim represents the catalyst gives a company edge and pushes it forward – whether through ground-breaking products, new management, or new service offering. The newer the change, the more recent the momentum.
Innovation as the Primary Growth Driver
Companies introducing revolutionary products or services often experience periods of rapid growth as these innovations capture market share and open new revenue streams. This “newness” factor can propel companies from average performers to market leaders.
New Products and Services: Catalysts for Explosive Growth
Some of the most dramatic stock price advances in history have followed the introduction of game-changing products:
- Apple with the iPhone (2007)
- Netflix transitioning to streaming (2007)
- Amazon launching AWS cloud services (2006)
- Tesla with the Model S (2012)
- Nvidia with AI-optimized GPUs (2018)
These innovations weren’t just incremental improvements – they were transformative developments that fundamentally changed their respective industries and created massive new profit opportunities.
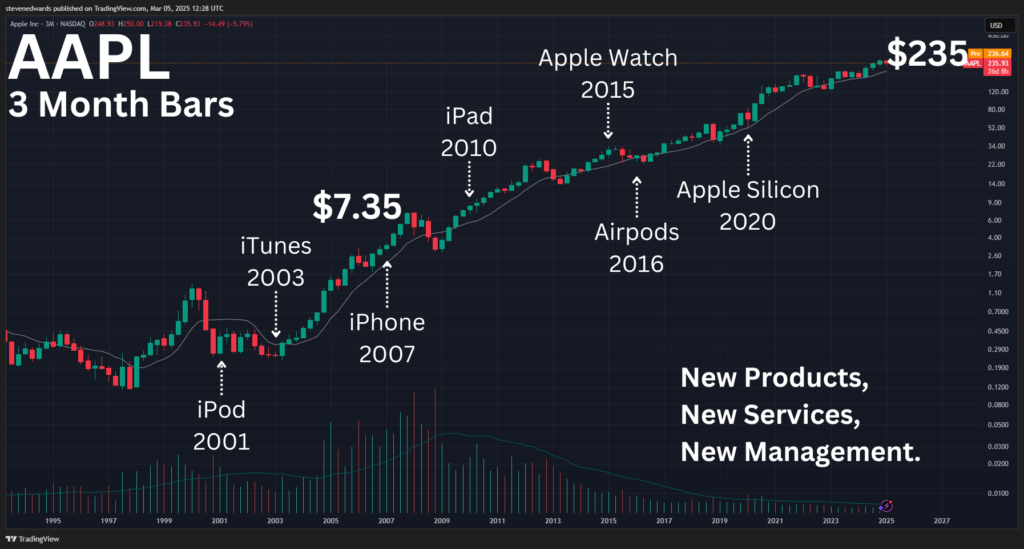
AAPL – Apple New Case Study
Apple’s history is defined by revolutionary product introductions, each driving new growth cycles:

- iPod introduction (2001)
- iTunes Store launch (2003)
- iPhone introduction (2007)
- iPad launch (2010)
- Apple Watch release (2015)
- AirPods introduction (2016)
- Apple Silicon transition (2020)
Management Changes That Transform Company Performance
A change in leadership can breathe new life into stagnant companies. When evaluating management changes, look for executives with:
- Track record of success in the same or similar industry
- Clear vision and strategy for growth
- Ownership stakes in the company (skin in the game)
- Focus on innovation and market leadership
MICROSOFT Case Study (MSFT) under Satya Nadella:
CEO change announced: February 2014
Stock price at announcement: ~$38
One year later: ~$43 (+13%)
Five years later: ~$120 (+216%)
Seven years later: ~$330 (+769%)
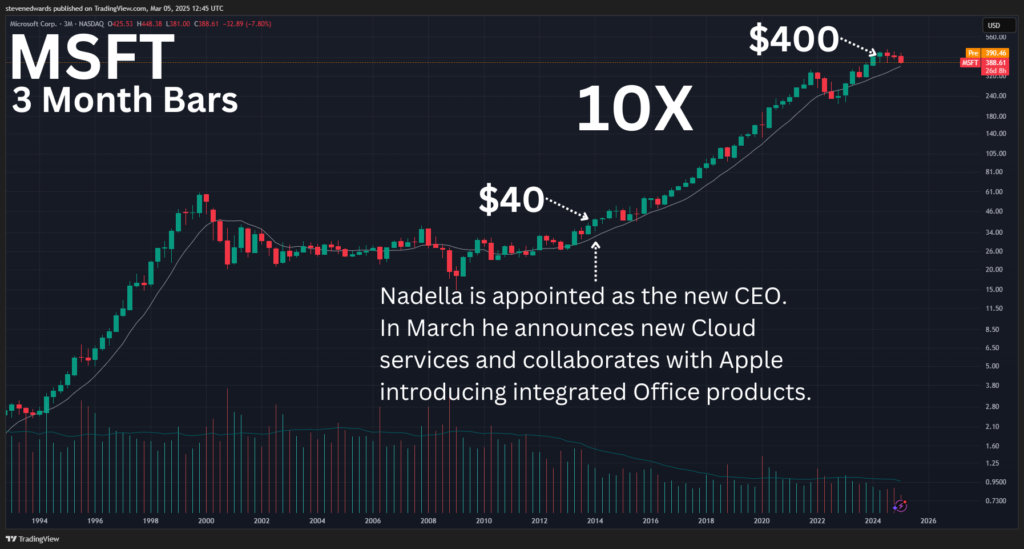
When Satya Nadella took over as Microsoft CEO in 2014, he shifted the company’s focus toward cloud computing and subscription services. Nadella’s strategic shift toward these new services completely revitalized Microsoft’s growth trajectory after being stagnant since 2001.
The Power of New All-time Highs in Price Action
Perhaps the most controversial aspect of CANSLIM is its emphasis on buying stocks as they reach new highs – contrary to the common “buy low, sell high” wisdom that most investors follow.
O’Neil’s extensive research revealed that stocks making new 52-week highs, especially after emerging from a proper base pattern, often continue to make even higher highs. This price action indicates institutional accumulation and positive momentum.
Why Buying at New Highs Works
Buying at new highs works because:
- Overhead supply is eliminated – Everyone who bought previously is now profitable, reducing selling pressure
- Momentum attracts more buyers – Success begets success in the market
- It confirms all other positive factors – A stock reaching new highs validates that its fundamental strength is being recognized
S – Supply and Demand
Supply and Demand governs price movement and it’s integral to the Canslim investing system, especially when evaluation a stocks technical price action. It helps to identify stocks with potential for massive price advances and it determines how fast a stock moves and how far.
Understanding Share Supply and Its Impact on Price Movement
When there are fewer shares available to trade (the float) then the stock will have more volatile price movements up or down. The supply of shares available in the float plays a crucial role in a stock’s behaviour. A stock with a larger float is going to be more stable and will potentially move far slower.
When there aren’t many shares to go around, demand is going to easily push the price action higher.
Institutions buying a stock with a float under 100 million will have far more power over the price than a stock with one billion shares outstanding. This means institutional investors can move the stock’s price with their orders. It’s one of the reasons they take months to build positions quietly in stocks vs buying all at once and sending the price sky high.
Volume Analysis Fundamentals for CANSLIM Investors
Volume is the most important indicator of supply and demand in the stock market. Here’s what to look for:
- Above-average volume on breakouts – Indicates strong demand from institutional investors
- Volume increases on up days – Shows continued accumulation at higher prices, pure demand
- Volume decreases on down days – Weak selling pressure, sellers might be loosing steam
O’Neil recommended looking for at least 50% above-average volume on breakouts to confirm strong institutional interest.
Reading Supply and Demand Signals in Chart Patterns
Several key patterns can help you identify favourable supply-demand dynamics:
- Tight price consolidation – Indicates minimal selling, buyers and sellers are balanced
- Price holding near highs on low volume – Shows lack of selling interest
- Higher lows during pullbacks – Demonstrates increasing support levels
- Volume dry-ups near the lows – Signals selling exhaustion
These patterns often precede significant price advances as they indicate that selling pressure is diminishing while buying interest remains strong.
Spotting Institutional Accumulation Before Major Moves
Institutional investors (mutual funds, pension funds, etc.) can’t buy all their shares at once – they accumulate positions over weeks, months or even years when there is sustained growth. Accumulation leaves footprints that CANSLIM investors can identify:
- Heavy volume without price declines – Indicates absorption of supply
- Multiple days of above-average volume – Sustained institutional interest
- Support at logical levels (moving averages, prior breakouts) – Institutional support
These signals can help you identify which stocks the “smart money” is accumulating before major price moves occur.
L – Leader or Laggard
Not all stocks are created equal, even in strong industries. The “L” in CANSLIM stand for finding the market leaders vs avoiding the laggards. Leaders are consistent in their growth, have explosive fundamentals that allow the stock to outperform their industry peers.
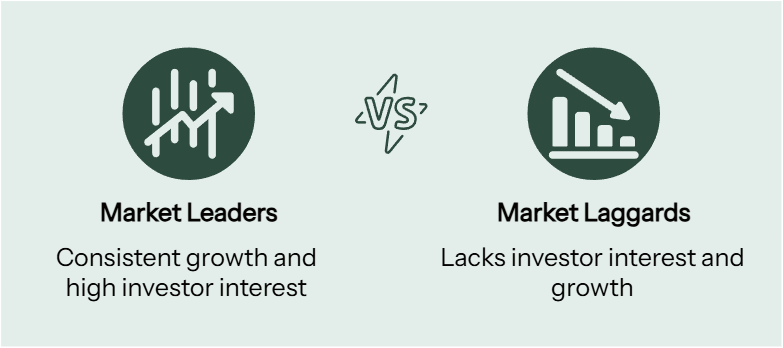
Following Canslim means finding the best stocks at the best time where investor interest is at all time highs and institutions are fighting each other to purchase shares. No one is fighting over laggards in the market, they are all going after the natural leader of the pack.
“From the early 1950s through 2008, the average RS Rating of the best-performing stocks before their major run-ups was 87. In other words, the best stocks were already doing better than nearly 9 out of 10 others when they were starting out on their most explosive advance yet. So the rule for those who are determined to be big winners in the stock market is: look for the genuine leaders and avoid laggards and sympathy plays. Don’t buy stocks with Relative Strength Ratings in the 40s, 50s, or 60s.”
― William J. O’Neil
Why Industry Group Leadership Matters for Stock Selection
Approximately 75% of a stock’s price movement is influenced by its industry group and the overall market. Finding the right industry at the right time dramatically increases your chances of success.
Focus your attention on the leading industry themes.
Industry leadership typically rotates throughout market cycles. During the 2020-2021 bull market, for example, leadership rotated from stay-at-home technology stocks to energy stocks. Identifying these rotations early can lead to substantial outperformance.
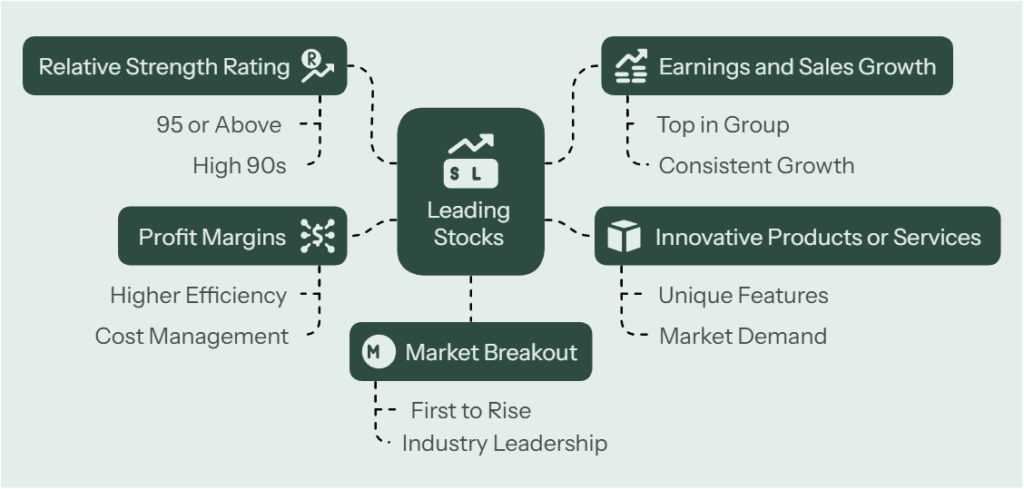
How to Identify True Market-Leading Stocks
Within leading industry groups, focus on the top performers – not the second or third-tier players. Look for:
- Highest Relative Strength Rating (ideally 95 or above on a 1-99 scale, Most leaders are going to have RS in the high 90s)
- Strongest earnings and sales growth in the group
- Most innovative products or services
- Superior profit margins compared to competitors
- First to break out from bases in the industry
The best stock in a strong industry will typically outperform the second-best by a wide margin. Don’t settle for “sympathy plays” or cheaper alternatives.
Relative Strength: The Key to Outperforming the Market
Relative strength measures how a stock’s price performance compares to the broader market. O’Neil’s research found that stocks with a Relative Strength Rating of 80 or higher (meaning they outperformed 80% of all other stocks) were far more likely to become big winners.
To evaluate relative strength:
- Compare the stock’s performance to its industry group
- Compare the stock’s performance to the S&P 500 or Nasdaq
- Look for stocks showing increasing relative strength
Avoiding Sympathy Plays and Underperforming Stocks
A common mistake is buying “sympathy plays” – stocks that seem similar to or in the same industry as a high-flying leader, but which lack the fundamental and technical strength of the leader.
For example, during Amazon’s rise, many investors bought other e-commerce companies that never matched Amazon’s performance. Focus on the true leaders, not the followers.
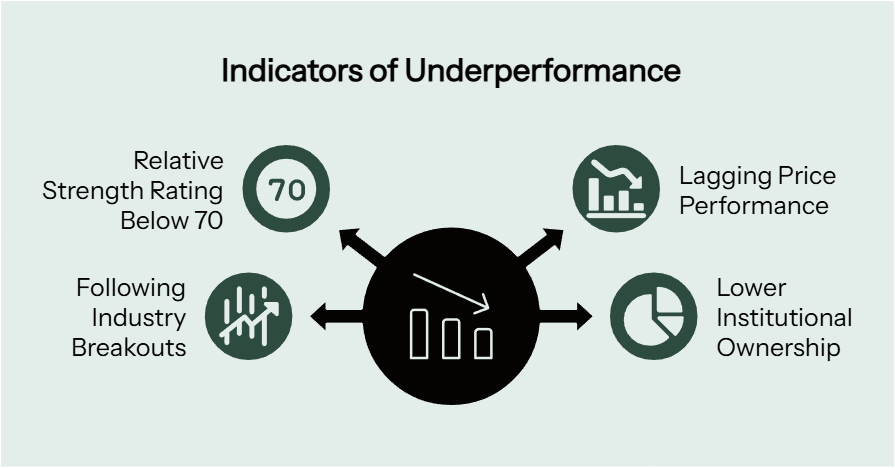
Signs a stock is a laggard rather than a leader:
- Below-average earnings growth compared to peers
- Relative strength rating below 70
- Lagging price performance within its group
- Following rather than leading industry breakouts
- Lower institutional ownership than group leaders
Effective Methods to Measure Relative Strength
Beyond simply comparing price performance, you can measure relative strength in several ways:
- Relative strength line – A line that tracks stock performance versus the S&P 500
- Sector/industry comparison – Performance versus specific sector ETFs
- Peer comparison – Direct comparison to closest competitors
- New high analysis – Frequency of new 52-week highs versus peers
The most reliable indicator is often the relative strength line – when it’s reaching new highs, especially before the price does, it can signal extraordinary future performance.
Comparisons: Leaders vs. Laggards
Consider these contrasting examples from the electric vehicle industry in 2020-2021:
Leader: Tesla (TSLA)
- Relative Strength Rating: 99
- Earnings Growth: Turning from losses to massive profits
- Price Performance 2020-2021: +743%
Laggard: Workhorse Group (WKHS)
- Relative Strength Rating: Initially high but deteriorating
- Earnings Growth: Continued losses
- Price Performance 2020-2021: Initial surge, then -71% decline
While both stocks initially moved up, the leader (Tesla) sustained its advance while the laggard (Workhorse) ultimately collapsed.
I – Institutional Sponsorship
Individual investors aren’t enough to drive major stock price moves. The “I” in CANSLIM focuses on institutional sponsorship – the ownership and accumulation of shares by professional money managers like mutual funds, pension funds, and hedge funds.
Following the Smart Money: Why Institutional Ownership Matters
Institutional investors control trillions of dollars and account for approximately 70-80% of all market activity. Their buying power can drive stocks dramatically higher, and their selling can create significant downward pressure.
O’Neil’s research found that virtually all major winning stocks had increasing institutional ownership before and during their biggest price moves. This “smart money” validation is a crucial confirmation of a stock’s potential.
Optimal Institutional Ownership Levels for Growth Stocks
Not all institutional ownership is created equal. The ideal scenario includes:
- Growing number of institutional owners (increasing quarterly)
- High-quality institutions among the owners (top-performing funds)
- Insider ownership alongside institutional interest (Management owning a % the stock)
Too little institutional ownership (under 20%) may indicate a lack of professional interest, while too much (over 70-80%) can create “over-ownership” where there’s little room for additional buying.
Quality vs. Quantity in Institutional Ownership Analysis
The quality of institutional ownership matters as much as the quantity. Look for:
- Top-performing growth funds among the owners
- Well-known, respected fund managers with good track records
- Specialist funds focused on the company’s sector
- Recent new positions by successful institutions
A stock owned by five top-performing growth funds is often more promising than one owned by 20 index funds or underperforming value funds.
Investors Business Daily can help you find the institutional ownership of a stock. Either MarketSurge, or IBD Digital.
Case Studies: Institutional Accumulation Success Stories
AppLovin (APP) 2023-2024:
- Q1 2023: 371 Institutional Owners
- Q2 2023: 425 (+14.6%)
- Q3 2023: 518 (+21.9%)
- Q4 2023: 579 (+11.8%)
- Q1 2024: 899 (+55.3%)
- Q2 2024: 1149 (+27.8%)
- Q3 2024: 1371 (+19.3%)
- Q4 2024: 1799 (+31.2%)
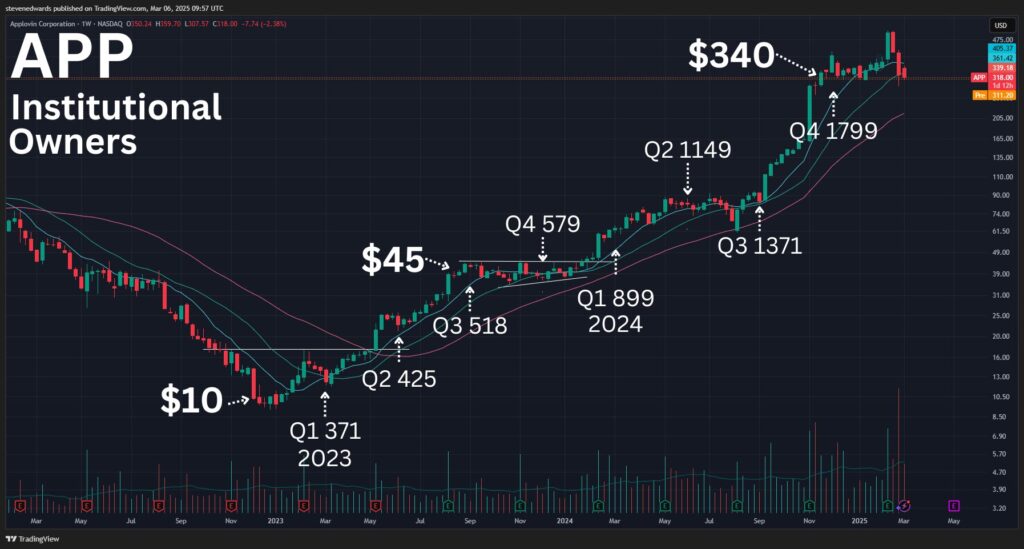
The dramatic increase in institutional ownership coincided with (and helped fuel) AppLovin’s remarkable price appreciation during this period. Institutional investors rapidly accumulated positions, driving the stock to extraordinary heights.
M – Market Direction
The Market Tide that Lifts (or Sinks) All Boats
O’Neil’s research found that approximately 75% of all stocks move in the same direction as the general market. This means that even the best stocks with perfect fundamentals and technicals will struggle during bear markets, while average stocks can outperform during strong bull markets.
Understanding market direction is absolutely critical to CANSLIM success – it tells you when to be aggressive, when to be defensive, and when to stay on the side-lines entirely.
“The moral of the story is: never argue with the market. Your health and peace of mind are always more important than any stock.” – William O’Neil
Understanding market direction isn’t just about improving your returns – it’s about avoiding catastrophic losses. Most devastating drawdowns occur when investors fight against major market downtrends rather than respecting them.
Remember, the “M” in CANSLIM isn’t just one of seven equal factors – it’s the foundation that makes the other six factors work effectively. As William O’Neil often emphasized, following the general market direction is the single most important decision you’ll make as a CANSLIM investor.
The 75% Rule: Why Most Stocks Follow the Overall Market
The 75% rule is one of the most important principles in trend trading. It states that roughly three out of four stocks will follow the general market direction, regardless of their individual merits. This happens for several reasons:
- Index effect – Major stocks are components of indexes, so selling pressure on indexes directly impacts these stocks
- Liquidity cycles – When institutions raise cash, they sell across their portfolios
- Risk sentiment – Market psychology tends to affect all stocks simultaneously
- Sector correlation – Related industries often move together
This rule explains why even stocks with excellent fundamentals can decline significantly during bear markets. No matter how strong a company’s earnings or how innovative its products, swimming against a bearish tide is extremely difficult.
For CANSLIM investors, this means market direction should be your first analytical step – before looking at individual stocks or making any buying decisions.
When to Be Aggressive vs. When to Be Defensive
Your trading posture should align with the current market environment:
Aggressive Stance (Strong Bull Market):
- Building full positions in leading stocks
- Pyramiding winners with follow-on buys
- Holding through normal pullbacks
- Potentially using margin (for experienced traders)
- Focusing on highest-growth leaders
Defensive Stance (Weakening Market):
- Taking profits on extended winners
- Reducing position sizes on new purchases
- Raising your cash position
- Tightening stop-losses
- Being more selective with new buys
Highly Defensive Stance (Confirmed Downtrend):
- Moving largely to cash (80-100%)
- No new buying except special situations
- Considering inverse ETFs or shorts (experienced traders only)
- Building watch lists for the next bull phase
- Focusing on education and preparation
How to Determine Market Direction
Now that you understand the importance of market direction, let’s examine how to accurately analyse it using the CANSLIM method.
“Be completely objective and recognize what the marketplace is telling you, rather than trying to prove that what you said or did yesterday or six weeks ago was right. The fastest way to take a bath in the stock market is to try to prove that you are right and the market is wrong. Humility and common sense provide essential balance.”
― William J. O’Neil
Following the Major Market Indexes
The most reliable indicators of market direction are the major market indexes themselves:
- S&P 500 – Represents large-cap stocks across sectors
- Nasdaq Composite – Technology-heavy, growth-oriented index
- Dow Jones Industrial Average – 30 large blue-chip companies
- Russell 2000 – Small-cap stocks
For CANSLIM trend traders, the Nasdaq Composite and S&P 500 are particularly important, as they contain most of the growth stocks that meet other CANSLIM criteria.
When analysing these indexes, pay attention to:
- Price action – Is the index above or below key moving averages (50-day, 200-day)?
- Volume patterns – Is volume expanding on up days and contracting on down days?
- Support/resistance levels – Is the index respecting key technical levels?
- Higher highs/higher lows – Is the index maintaining an uptrend structure?
Distribution Days: Detecting Professional Selling
One of O’Neil’s most valuable contributions to market analysis is the concept of distribution days – a powerful tool for identifying potential market tops before they fully develop.
What is a distribution day? A distribution day occurs when a major market index closes lower by at least 0.2% on higher volume than the previous day. This indicates institutional selling pressure – the “smart money” may be distributing (selling) shares to the public.
The Distribution Day Count:
- Track distribution days over a rolling 25-trading-day window (approximately 5 weeks)
- When 4-5 distribution days accumulate within this window, market risk increases
- The more distribution days cluster together, the more bearish the signal
Follow-Through Days: Confirming New Uptrends
While distribution days help identify market tops, follow-through days help confirm new market bottoms and emerging uptrends.
What is a follow-through day? A follow-through day occurs on the 4th through 7th day of an attempted rally following a market decline. It requires the index to rise at least 1.5% (preferably more) on volume higher than the previous day.
Key characteristics of valid follow-through days:
- Occurs on day 4-7 of a rally attempt
- Price gain of at least 1.5% (stronger is better)
- Volume higher than the previous day (significantly higher is better)
- Closes strong, near the high of the day
- Led by quality stocks (not just oversold bounces in laggards)
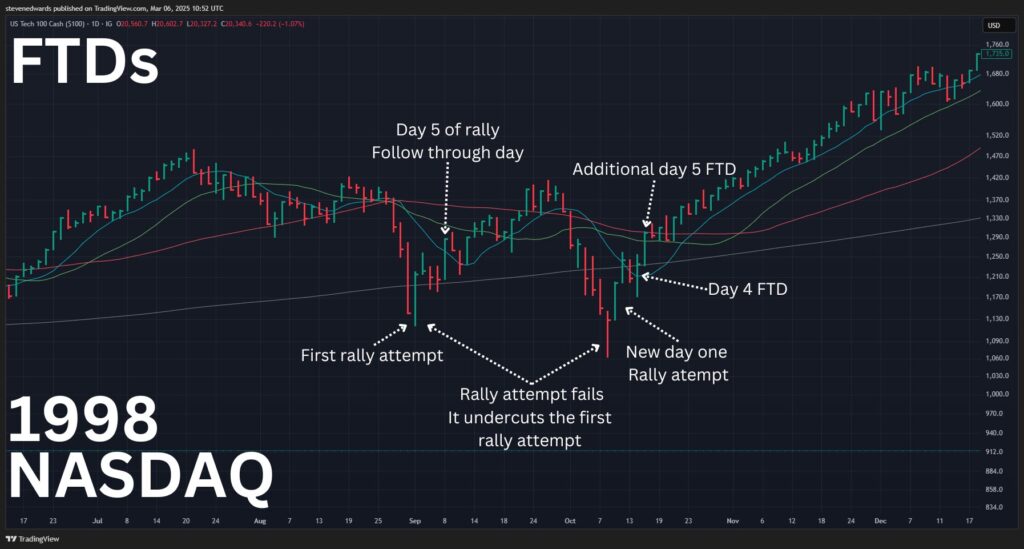
Why follow-through days matter: While not every follow-through day leads to a sustained uptrend, virtually every major bull market in history has begun with a follow-through day. This signal suggests institutional investors are now supporting the new uptrend with real buying, not just short-covering.
Advanced Market Health Indicators for CANSLIM Traders
While distribution days and follow-through days are the primary CANSLIM tools for market direction analysis, several other indicators can provide valuable confirmation:
- Market breadth indicators:
- Advance-decline line
- Percentage of stocks above 50-day moving average
- New highs vs. new lows
- Sector performance:
- Are market-leading sectors holding up?
- Is leadership rotating or narrowing?
- Are defensive sectors outperforming?
- Behaviour of leading stocks:
- Are the strongest stocks breaking down or holding firm?
- Are base breakouts succeeding or failing?
- Are stocks reacting positively or negatively to good earnings?
Recognizing Market Turning Points
Identifying major market turning points (tops and bottoms) is crucial for CANSLIM investors. Let’s examine the key signals for each.
Market tops typically form with these characteristics:
- Distribution days (heavy selling on higher volume) clustering within a short period
- Leading stocks breaking down despite good news
- Deteriorating breadth (fewer stocks making new highs)
- Failed breakouts becoming more common
- Speculative, low-quality stocks outperforming
Market bottoms typically show these traits:
- Selling climax on massive volume
- Successful retest of the lows
- Follow-through day (strong up day on higher volume after an attempted rally)
- Leading stocks forming bases
- Positive divergences in breadth indicators
Adapting Your Trading Strategy to Market Conditions
The “M” in CANSLIM requires you to adjust your strategy based on market conditions. Here’s how to adapt to different market environments:
Bull Market Strategies
When the market is in a confirmed uptrend (after a follow-through day with limited distribution):
Bear Market Strategies
When the market is in a confirmed downtrend (6+ distribution days, indexes below key moving averages):
Bottoming Market Strategies
When the market is attempting to bottom (after potential capitulation, testing lows):
Common Market Direction Mistakes
Even experienced CANSLIM investors make mistakes with market direction. Here are the most common errors to avoid:
Fighting the Trend
Common mistake: Continuing to buy stocks in a down trending market because they “seem cheap” or have good fundamentals.
Solution: Respect the power of the general market trend. Remember the 75% rule – most stocks follow the market direction. Wait for a confirmed uptrend before committing significant capital.
Ignoring Distribution Days
Common mistake: Dismissing distribution days as “normal pullbacks” or focusing only on price while ignoring volume signals.
Solution: Establish a systematic process for tracking distribution days. Create a simple spreadsheet or journal to monitor each major index daily for distribution signals.
Missing Follow-Through Opportunities
Common mistake: Being too scared to buy after a severe market decline, even after a valid follow-through day confirms a new uptrend.
Solution: Prepare a watch list of the strongest stocks during the decline. Have specific buy plans ready to execute when the follow-through day occurs. Start with smaller positions if you’re nervous.
Reacting to News Instead of Price Action
Common mistake: Making decisions based on headlines, economic reports, or Federal Reserve announcements rather than actual market behaviour.
Solution: Remember that the market discounts all known information. Focus on price/volume action in the major indexes and leading stocks, not the news cycle.
Leave a Reply