I stumbled across an incredible deep study of breakouts by Florin, mastertradingflow. He began trading full-time in 2022 and spent countless hours researching what made breakouts successful and prone to failure.
Flo’s completed studies are extensive, so I have chosen to make this two part resource.
- Part 1 Initial Findings and Historical Breakouts Map
- Part 2 Successful Breakouts and Unsuccessful Breakouts
Masertradingflow’s study
Flo studied 2578 stocks over six years. His approach succeeded in finding statistical details that defined certain breakout edges. Over three hours of content detailing his results can be found on his website and Youtube page.
There is some survivorship bias built into these studies. In addition to breakouts he also studied breakdowns which adds further actionable insights.
ETFs, Biotech’s, stocks under three dollars and those trading under 100K volume were excluded. The data period was from Jan 2017 – Dec 2022.
Qullamaggie breakouts:
Flo chose breakouts as defined by Qullamaggie, therefore making the study objective and measurable.
A measured move higher, 30-100% lasting from three days to three weeks; followed by an orderly consolidation of higher lows and tightening price action (consolidation). Then a range expansion which is the breakout.
Market caps
Of the 2500 plus stocks Flo studied, 1830 had market caps between one and ten Billion. The remaining 750 stocks were over 10 Billion.
Flo found a total of 963 breakouts, 837 breakouts were from under 10B market cap stocks (87%) and 126 breakouts occurred above 10B market cap weight (13%).
Broadly speaking, large caps hold less risk, they are less volatile and slower moving compared with small and medium caps. Higher growth potential is found within the smaller caps but there’s also the snag of less liquidity and less institutional attention.
Conservative traders may want to focus on large caps while more aggressive traders would do well to focus on the small and medium caps. However some additional parameters to stock selection may help reduce the risk of small caps while still maximising the gains, such as using William O Neil’s fundamental growth metrics.
Here is an intriguing data point comparing small caps to large caps.
- Most small to medium caps breakout higher than 16% after consolidation in 76% of cases, whereas the majority of large caps only increase 8-20%
Focus on small caps for explosive growth and abundant setups, (with volatile account growth) or focus on large caps with lower explosive power for a smoothed equity curve.
Breakouts per month
- 13.88 breakouts occur per month between 2017 and 2021
- 10.70 breakouts per month during 2022 (bearish environment)
This seems on first appearance quite good, however during 2022 there was a geopolitical energy sector slant to the data. We saw many breakouts then in the energy sector due to the war in Ukraine. Without this conflict there would have been even less breakouts during this period.
- 7.6 breakouts per month during 2022 (not including energy sector plays)
During bear markets, there are markedly less breakouts than usual. Taking this further, we could argue that the quality of these breakouts would be impacted due to the environment. Keep in mind investors are more likely to take profits quicker in bear markets while the indexes are falling hard.
Gap ups and breakouts during bear markets are opportunities for funds and institutions to sell into. This is distribution. From O’ Neil himself – “You absolutely do not buy breakouts during a bear market. Most of them will fail.”
Breakout Clusters
Breakouts are not evenly spread out during bear markets, instead they cluster around bullish trend reversals before being sold into. You can try to make hay while the sun is shining during bear markets if that fits with your trading system, but it may be more profitable to wait for better markets.
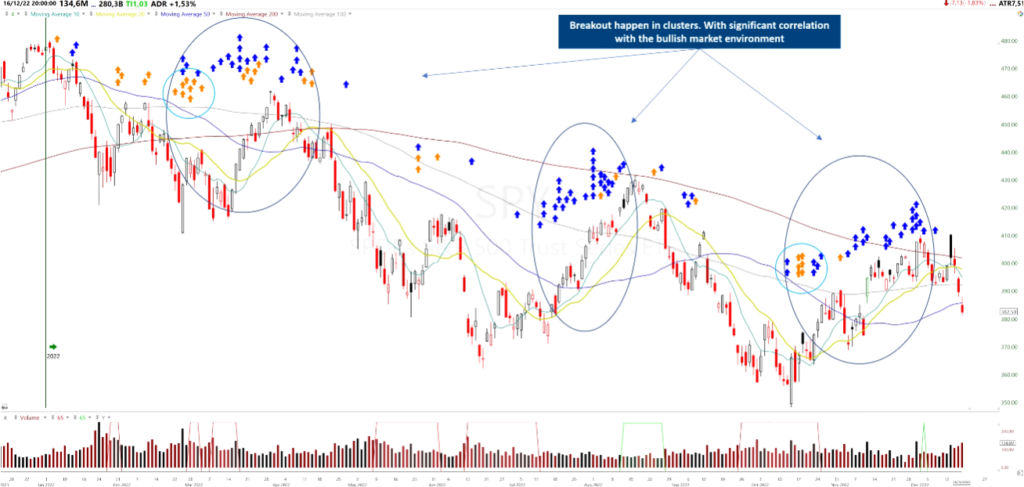
You can see the clusters of breakouts during bear market of 2022 in blue.
The longer a bear market lasts, the better the opportunities and trends on the other side.
Taking advantage of breakouts during a bear market is a choice, generally, they are more prone to failure, the risk to reward has to be very tight due to the multiple failures and this could all negatively affect your win to loss ratio and other metrics of profitability.
Do you have a rule on whether to trade during bear markets?
Breakout pattern ratios
As seen in this picture below, the patterns follow particular ratios. The most popular pattern is the flat channel, second is the upward trending flag and the least popular could almost be ignored due to their rate of appearance during this study, The down flat flag and the symmetrical flag.
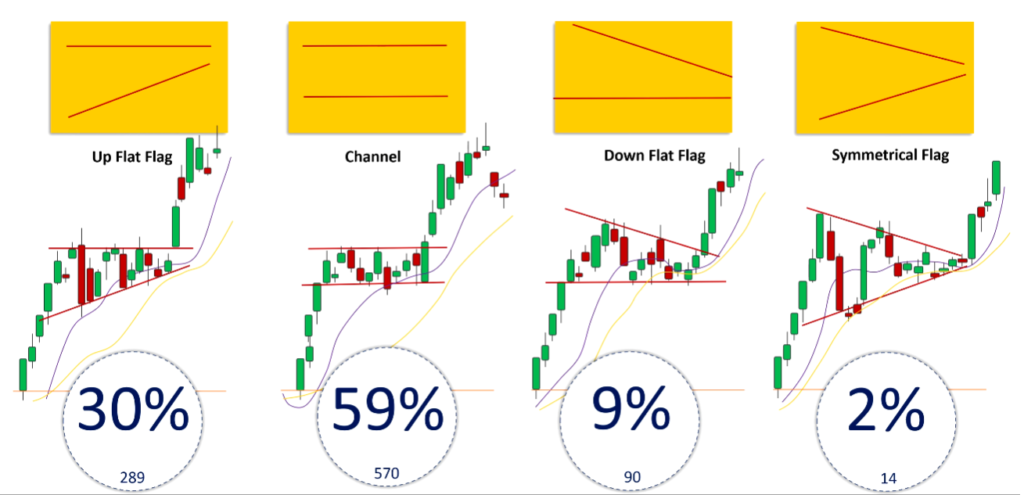
- Focus on learning these two most popular patterns inside and out, and perhaps pay attention to the down flat flag if you want to be well-rounded
- Finding the most significant flat top resistance line is the most significant takeaway here, also take note of the best stop-loss placement in your studies.
- Flo focused attention on 30 minute intraday charts too, to map this resistance. It may be a helpful exercise to study from in future.
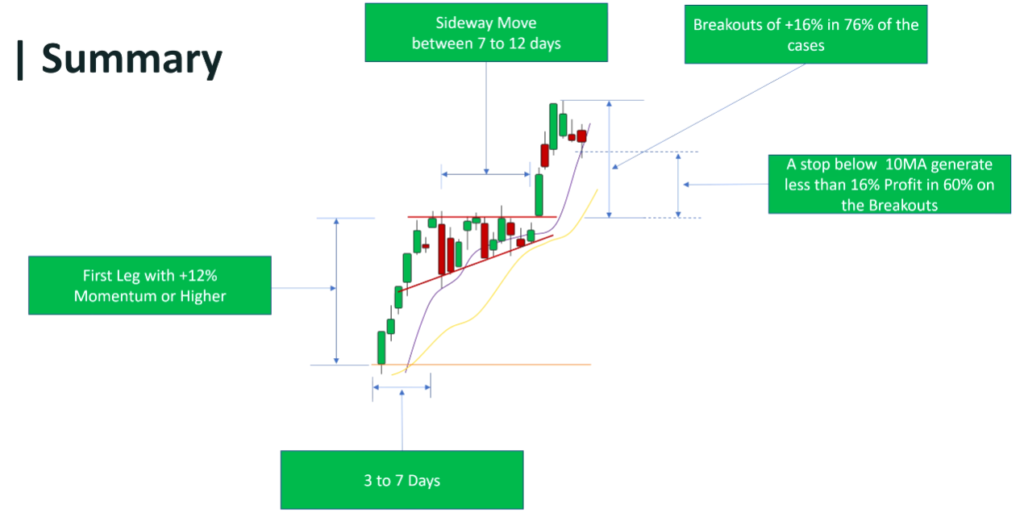
Pattern price action statistics
These statistics are worth memorising as you will be able to build a picture of the price action in your mind and spot it easily in the charts.
- In 72% of breakouts, the first leg up into consolidation took 3-7 days on average
- 12% – 26% price movement in the first leg up is a sign of strength and momentum
- For large caps (>10B) expect between 8 – 20% price increase into consolidation
It might be worth building a bank of your own screenshots of breakouts to refer to and revise. This repetitive work is useful in building intuition and instant recognition.
- Price consolidated for around 7-12 days in small and medium caps (<10B). Also there are a number of consolidation periods between 13-19 days also.
- Most small to medium caps breakout higher than 16% after consolidation in 76% of cases whereas the majority of large caps only increase 8-20%
An important and exceptional piece of information is the extent to which the breakout relates to the first leg up into consolidation.
- The first leg up into consolidation and the breakout leg are in most cases symmetrical in percent increase.
Historical map of breakouts
Breakout clusters
Flo’s data suggests there are a number of different “clusters” of breakouts shown in different stages of the trend.
These can be sector clusters, where breakouts are occurring due to sector rotation, clusters of leading stocks that are breaking out before the general market is in an uptrend, or lagging stocks which are breaking out once the uptrend is confirmed.
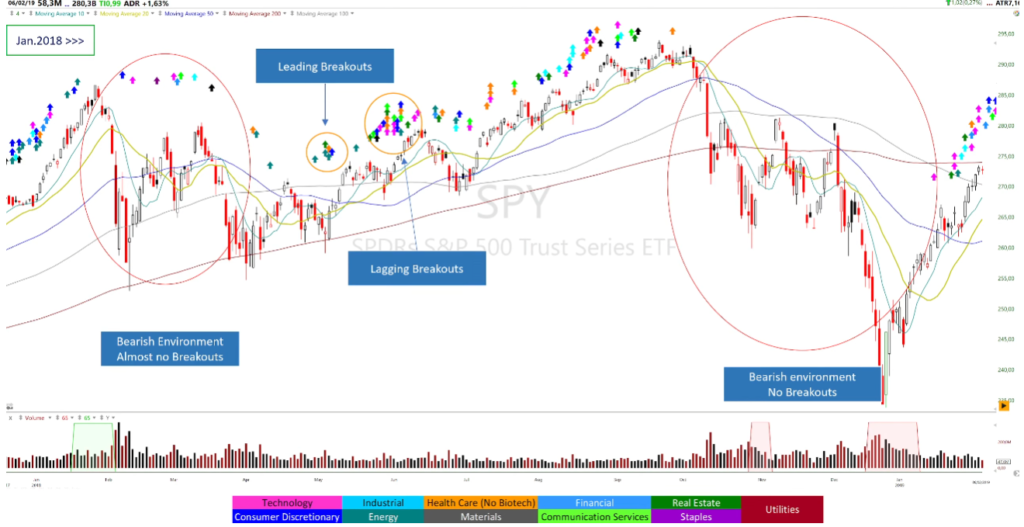
There are also areas where there are no stocks are breaking out. Here are a few takeaways from the study.
- Breakouts during bearish environments are rare, sometimes due to macro factors or sudden fundamentals such as energy shortages and scarcity.
- You can see where leading stocks break out ahead of the trend change and lagging stocks break out after confirmation of the uptrend.
- Continuous breakouts (one or two each day) are a good sign of healthy markets and can be used as a diagnostic tool for favourable environments.
Leading breakouts are often going to show the most relative strength against the market and have the greatest price progression because of this. Once the market confirms an uptrend, the lagging stocks begin breaking out and form a second wave of momentum.
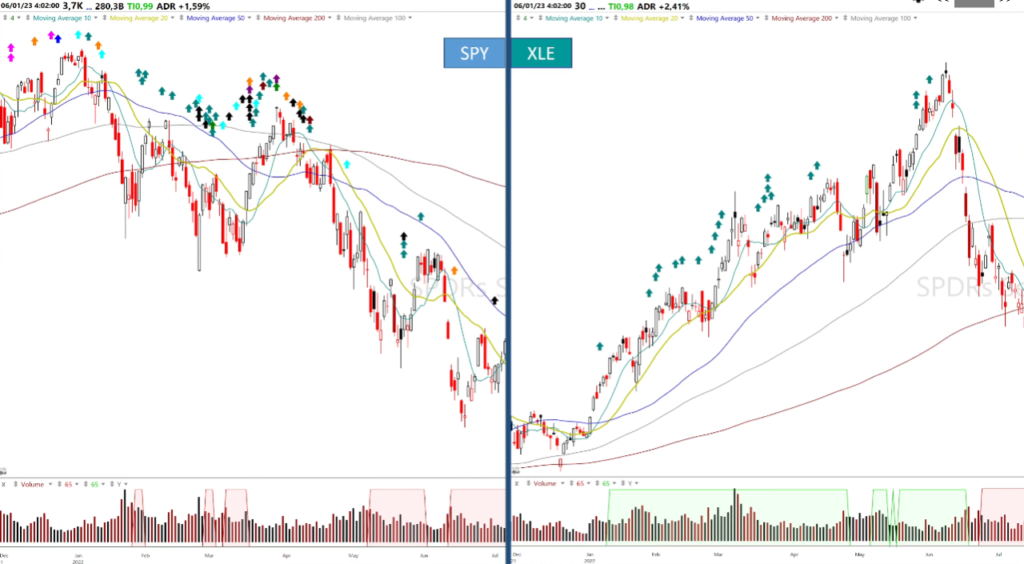
- Energy sector rotation is clear to see and shows the importance of tracking sector ETFs for breakouts and for leading stocks in hot areas. See the image below, two charts covering the same timeframes showing relative strength.
Absence of breakouts
Sometimes trading can become bleak, but it’s important to recognise what state the market is in, or is leading to. Here are a few key points we must recognise and come to terms with regarding bear markets and mid-term corrections.
- An absence of breakouts could be the first sign of upcoming short term or long term downtrend, topping action or stalling action.
- During market corrections and bearish environments, we see a low number of breakouts or at times, none at all.
- There was a period of 4-5 months where there was not one breakout to trade. In this environment it’s best to wait for more favourable market trends.
- 2020 and 2021 were outlier years, their data skews the results somewhat so it’s best not to expect such favourable environments in the near future.
End of part one
Click here for part two!
If you want to hear when new resources are added to the website, scroll down and subscribe to my newsletter.
I’ll send updates once a month or less.
Thanks for reading!
Leave a Reply